Introduction to data management
Introduction

Image source: ESA workshop on effective data management in 2011
This blog post will teach you how to enter, organize, and analyze your data when you’re getting started with a research project….so don’t hate yourself in a few months when you sit down to analyze the data! (Believe me, I’ve been there)
In this post, I'll cover some best practices for storing and organizing your data so you can spend your precious time analyzing it instead of re-organizing it!
There is a cycle of data management (modified from Jason Tallant's Data Management Presentation, the genesis of where I learned how to manage data), and I am going to describe the "planning" step.
Where to begin? Think of the data you need.
The best time to start thinking about your data organization is right away, that is to say, right when you start designing an experiment. When designing an experiment, you'll start with a question that you want to answer. You'll want to think of what kind of results you'll need to answer that question.
You'll want to ask yourself the following questions (taken from a presentation by Jason Tallant at the University of Michigan Biological Station):
What data needs collected to address the questions?
What analysis and software will be used?
How, when, and where will the data be acquired?
Define a workflow and refine when needed.
For example, if your question is does bacteria exert negative priority effects against yeast, you'll want to think of a graph that will answer this question.
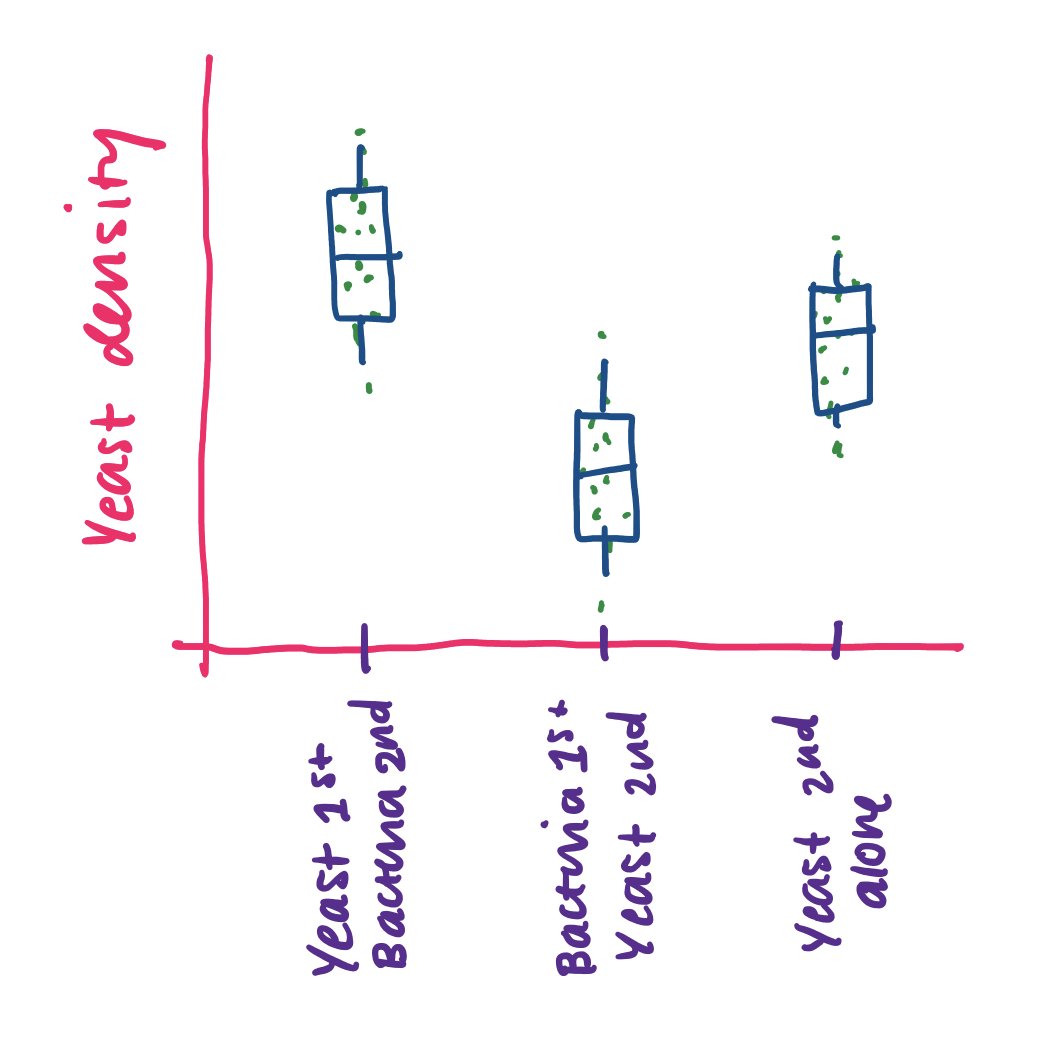
I might think of a plot like this:
Then, you want to think, what kind of data do I need to answer this question? Based on this plot, I definitely need yeast density information (and it would be nice to have bacteria density) in three different treatments:
Yeast 1st, bacteria 2nd (YB)
Bacteria 1st, yeast 2nd (BY)
Yeast 2nd alone (-Y) (and probably want to add in:
Yeast 1st alone (Y-)
Bacteria 1st alone (B-)
Bacteria 2nd alone (-B)
Negative control (no microbes) (--)
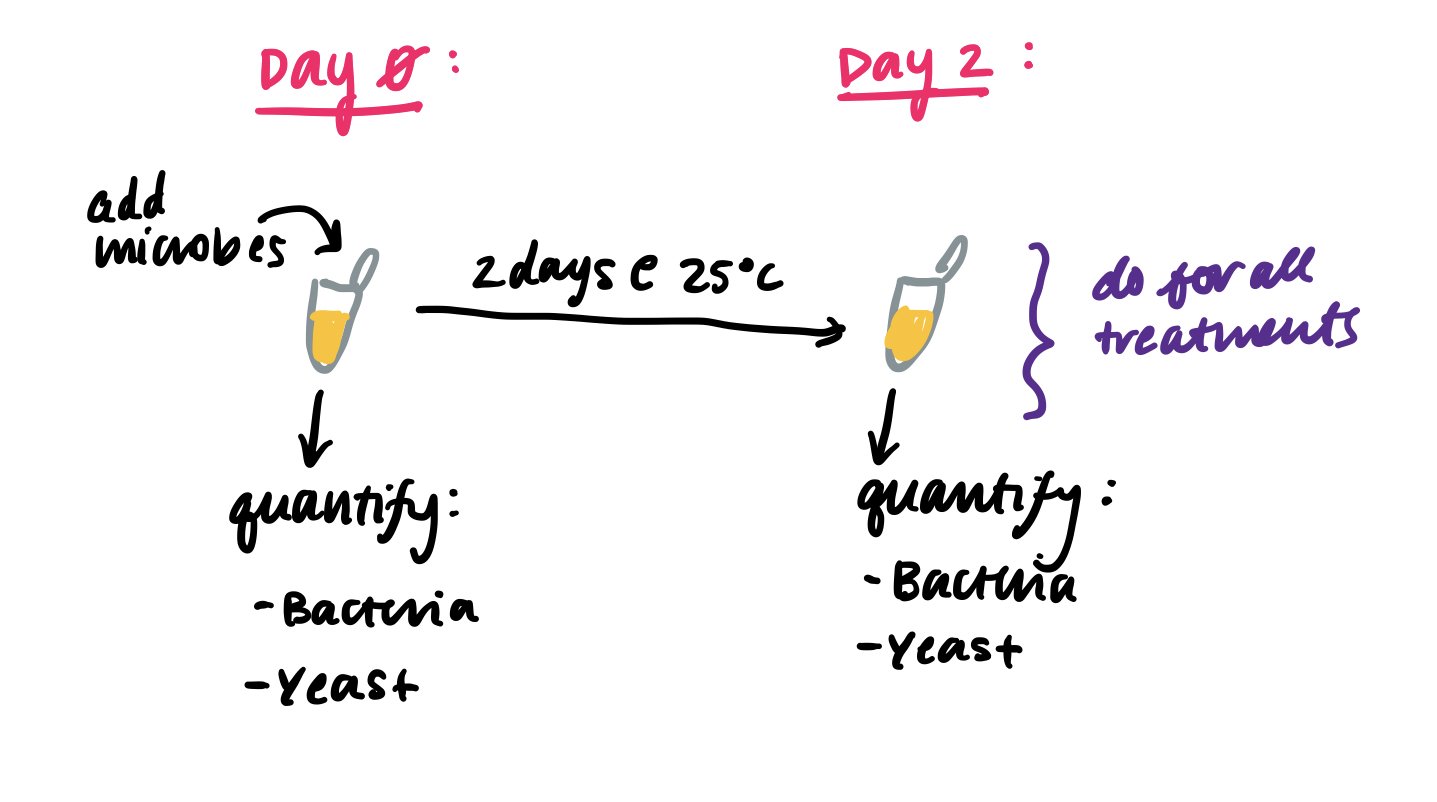
Of course, you'll need to design an experiment to test this, but for this post, let's just think about the data you'll get. With an experiment with this, you'll get yeast and bacteria final densities:
But in addition to these densities, you'll also have a bunch of other information that is also important for sorting the data. You should also keep note if the information is a quantity (number) or a category (character string):
Density of microbe (number)
The treatment (category, from a list, YB, BY, etc.)
Quantity of bacteria or yeast? (which microbe?) (category, either bacteria OR yeast)
Which day? (category, day 1 or 2)
Did you do the experiment multiple times? If so, what round? (category, round 1, 2, 3, etc. but this may look like a number!)
How do I organize a dataframe/spreadsheet?
First, I work backwards from the plot that I want to make.
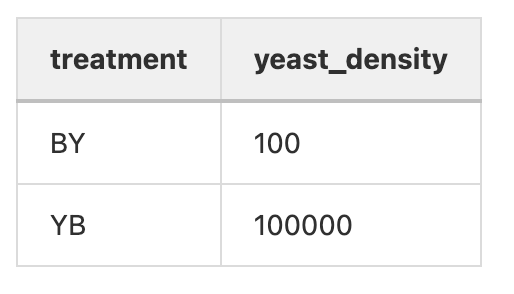
To make a boxplot in R, I'm going to need a dataframe (like a spreadsheet) with a column with X data and a column with Y data. In our example, the Y data is the yeast density and the X data is the treatment, so our dataframe with look something like this:
Pro tip #1: Each observation should be a separate row with your columns representing different variables
Pro tip #2: Always have your header names without spaces and lower case. When you call headers (variables) in R, you have to type it exactly the same. Having naming conventions helps you remember how to correctly call the variable.
This dataframe will make a plot like above (without the points) with the following code:
plot <- ggplot(data=yourdata, aes(x=treatment, y=yeast_density)) + geom_boxplot()
Now of course, you'll probably want to make a more complex plot that incorporates more colors, etc. that includes information such as yeast vs. bacteria density, etc.


To do this, you'll need to incorporate those other variables as columns as well:
Pro tip #3: Make sure that the information you are including in each column is matching with whether it is a number or a category. This is important when you call variables in R. For example, if you have 4 rounds, written as 1,2,3,4, R might think that these rounds should be read in as numbers, instead of categories that you arbitrarily gave numbers to. You can make sure this happens by locking the type of entry you put into your sheet (define the cell type as numeric or select from a drop-down list.
Here are some other best practices when structuring data in spreadsheets
One cell per observation (don't combine data in a single cell)/Each cell should be a singular unit of data (values)
Header line (the first row) describes the variables and units of measure
Columns are for variables and rows are for observations
No special characters or spaces (besides _)
Values should be “controlled” when possible for consistency
Columns should only contain one data type (numbers, letters, T/F, Y/N)
Make sure your NA, N/A, or NULL values are consistent with the analysis software (e.g. R, Python) you are planning to use and your zeroes (0) are actually zeroes and not null values.
If you have to list dates, use Year-Month-Day format: YYYY-MM-DD. See more information on what that is a good idea here.
Here is a great list of common spreadsheet errors!
Are multiple people going to work out of the same spreadsheet? Wouldn't it be a shame if one "bad apple" destroys all of the data? One fail-safe is having version control, but another is having quality control checks in place such as data validation. This is where you are restricted in what type of data you can enter into your sheet (e.g. through forcing everything in a column into a numeric or character type or forcing you to use a drop-down menu of pre-selected choices). Great post on this here.
Recap:
Make columns with different variables
Make rows with different observations
Define the type of variable (number, category/character string) before making your sheet
Don't use spaces or upper-case in your variable names
How do I make my sheet?
When deciding how to make your sheet, you want to think about how your data will be backed up and accessible. The best way to ensure your data is backed up is to save it on a cloud service like Dropbox, Google Drive, or Box. The best way to ensure your data is accessible, especially if many people are working on the same project, is to use a Google sheet.
I like to use Google Sheets for the following reasons:
Multiple people can access it simultaneously from different computers
Backed up to the cloud automatically
Tracked changes so we can revert to an older version in case of an error
Can download files in .csv file for storage in my lab notebook
So you want to set up your sheet with the specifications we listed above:

There are some important things to include:
1. How to export the file? When you export your file, make sure that you save it in a general file type as .csv (instead of excel) for future posterity, greater cross-platform/software operability, and minimize issues between versions. You can read more about this here.
2. Where to save the file? Save it in a marked data folder with every piece of data for a project (see lab notebook blog entry for more details)
Have a pre-planned data storage strategy

Don't let yourself be this person: (also from Jason)
Organize your files such that:
Separate Documents, Workflows, Procedures, Code, and Data into different folders
Stick with one file type, and use non-proprietary file types when possible (globally accessible types like .csv and .txt)
Come up with a system that logically tracks the versions of each file so that you know which is most up to data (there’s also software for this to help track the changes)
Create a README.txt file to describe your process or write it in your lab notebook
2. Consistent data types for every entry in a column As you can see, every date has the same data type (all are 10/25/2019 and not a mix with 2019/10/25 or Monday October 25th, 2019)
3. Metadata sheet: There is a tab with an explanation of what all of the columns mean and what their units are. This is important when sharing the sheet with a collaborator who may not know all of the details of what you did.
After making your sheet:
Some key points from this workshop from Data Carpentry:
Never modify your raw data. Always make a copy before making any changes.
Keep track of all of the steps you take to clean your data in a plain text file.
Organize your data according to tidy data principles.
4. Naming the file corresponding to the lab notebook entry This makes it clear what lab notebook entry this datasheet corresponds to.
Here are other considerations when creating immediately identifiable filenames: (from Jason)
Unique, but descriptive
Reflects content
Avoids spaces
Avoids special characters
Recap:
Make your datasheet a Google Sheet
Name it with your lab notebook entry
Keep your data types consistent
Include a metadata sheet
Some more information on metadata
Metadata is an important aspect of the data process.
Here is another great resource for managing metadata: https://www.dataone.org/sites/all/documents/ESA11_SS3_Metadata_WKM_Final.pdf
References:
Jason Tallant's amazing Data Management presentation
Ten Simple Rules for the Care and Feeding of Scientific Data